Demystifying AI part 5: Machine Learning Canvas

Continuing from our previous article on creating your own AI canvas where we elaborated on the need to create such a planning tool, the very same needs are required for any machine learning projects which have various elements to be mapped out and executed by a team full of members with varying expertise.
Much like a business model and an AI canvas, a machine learning (ML) canvas is a crucial means to map out all the tasks, challenges and risks associated with an ML project. With an ML canvas, all of your project’s requirements and touchpoints are assembled and mapped out in a simple chart to allow your team to gain a wide vision of your overall project and its vision.
For the purpose of this article, we’ll be referring to the Machine Learning Canvas created by Louis Dorard, founder of Own Machine Learning.
Why do you need an ML canvas?
An ML canvas allows you to set out your vision for your ML system, providing you with a consolidated map of what is required to realise your vision. It also allows you to communicate the project’s requirements with your team, so each member knows what is required not only of themselves but from the team as a whole. It is a powerful exercise for you and your team to quickly assess the feasibility of the project before diving head-first into what might be shallow waters.
As you begin to fill in your ML canvas, you will soon start to identify the key constraints of your proposed ML system. This will allow you to pivot ideas and routes you originally intended early on before deployment. Your identified constraints will help you locate barriers to entry and will impact the technology you end up using. ML canvases are great because they allow you to make changes and alterations to projects before you start them, saving you time and money.
How does it work?
Think of ML canvases as simple visual charts used to describe and map complex tasks in a simple way. But an ML canvas takes this a step further as it not only maps out a project’s requirements but also what will be learned at each step, informing the next. For example, you will quickly be able to ascertain what data you will be gaining insight from and how your predictions are being informed by that same data.
ML canvas breakdown

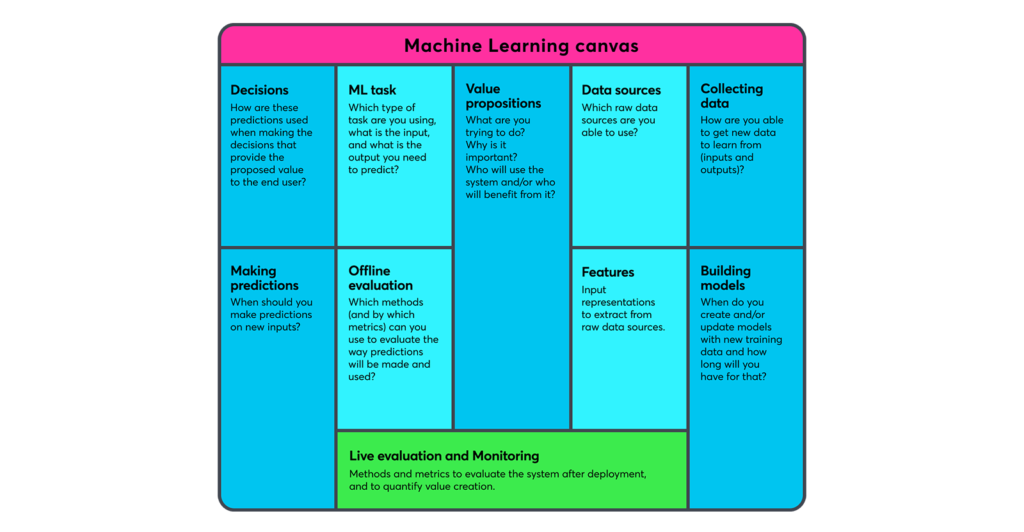
Your ML canvas is centred (quite literally) around the Value Proposition of the system where ML will be used. The central block of your ML canvas is therefore dedicated to your Value Proposition and it is where you will add the core reasoning for your project, such as: what are you trying to do, why is it important, who will use the system and/or who will benefit from it.
Once you have established solid reasoning (the What, Why and Who) for your Value Proposition you will then need to establish how you are going to proceed and hopefully succeed in achieving your desired outcomes. You can split the how into two components, making predictions and learning.
The blocks on the left-hand side of the canvas are your predictive assertions based on the various model elements of the MS system and data (which you will later learn from). Your predictions should include:
1. ML task
Which type of task are you using, what is the input, and what is the output you need to predict. Remember to include possible values too.
2. Decisions
How are these predictions used when making the decisions that provide the proposed value to the end user.
3. Making predictions
When should you make predictions on new inputs? It is also crucial to be aware of how much time is allocated for this, as each process relies on the next, and changes to one will more than likely affect others.
4. Offline evaluation
Here you need to ascertain which methods (and by which metrics) you can use to evaluate the way predictions will be made and used. You can do this before deployment.
Then, the blocks on the right-hand side are dedicated to the information you will learn from the data. They are comprised of the following:
- Data sources: Which raw data sources are you able to use?
- Collecting data: How are you able to get new data to learn from (inputs and outputs)?
- Features: Input representations to extract from raw data sources.
- Building models: When do you create and/or update models with new training data and how long will you have for that?
The top of your ML canvas should provide a broad background view of the process and the bottom part should provide the specifics of the system. Think of the top of the canvas as depicting an entire island on Google Maps, and as you move down the canvas to the bottom part you are zooming in slowly, being shown the intricate detail of the roads and river networks and how each part of the island is connected. The same applies to your ML project.
The upper left and right blocks are reserved for domain integration, where you can begin investigating how each prediction is used and how the data is collected in the application domain. The lower left and right blocks are for the predictive engine and its possible latency constraints and throughput for making predictions and updating models (if and when required).
Finally, the very bottom block of your ML canvas will be reserved for Live Evaluation and Monitoring. This is dedicated to measuring how well your system works on the domain side and is also where you will be able to specify methods and metrics in order to evaluate the system after deployment. From this, you will be able to finally quantify how much value your project has created and from here you will be able to determine your project’s ultimate viability.
To wrap things up
There you have it — your machine learning canvas is a really great planning and mapping tool to help you and your team get on the same page (literally) so you can all understand the required processes in order to get the job done. The sooner you start to implement an ML canvas to your projects, the sooner you will have a better understanding of the project flow and the processes required for it.
Pretty simple, right? That’s the point.
Don’t forget to check the previous articles of our series on AI:
- Part 1: What does an AI engineer do all day?
- Part 2: Exploring the industries which benefit from artificial intelligence
- Part 3: Getting started with an AI strategy and roadmap
- Part 4: What is an AI Canvas and how do you use it?
Mario Grunitz
Working Machines
An executive’s guide to AI and Intelligent Automation. Working Machines takes a look at how the renewed vigour for the development of Artificial Intelligence and Intelligent Automation technology has begun to change how businesses operate.


